Less noise.More reach.
In the first six months after Suubi Media took over the page, Gritworks Athletics posted less than half as many reels, and the typical reel went from 1,880 views to 3,042.
Median views per reel. 1,880 in the six months before, 3,042 in the first six months with Suubi Media running the page.
Reels that cleared 3,000 views. 4 before, 18 after, more than the whole year before combined.
Views on one reel. The May 1 post is the most watched reel on the account, out of 446 with public counts.
Daily reach in the first month. 374 people a day in week one, 1,170 a day by week four.
Fewer reels. Every one works harder.
Before, the account posted about 13 reels a month and most landed under 2,000 views. Starting in March, each reel was planned, shot and cut to hold attention in the first two seconds.
Each bar is the median view count of reels posted on @gritworks that month, read from the public reel counts on October 17, 2026. Older reels have had more time to collect views, so this view of the data leans in favor of the earlier months.
Six months down. Six to go.
July 3, 2026. 181 days left in the year, so the people in the gym talked about the first half of the year, on camera, in their own words. Posted to both gyms at once.
Same gym. A different first look.
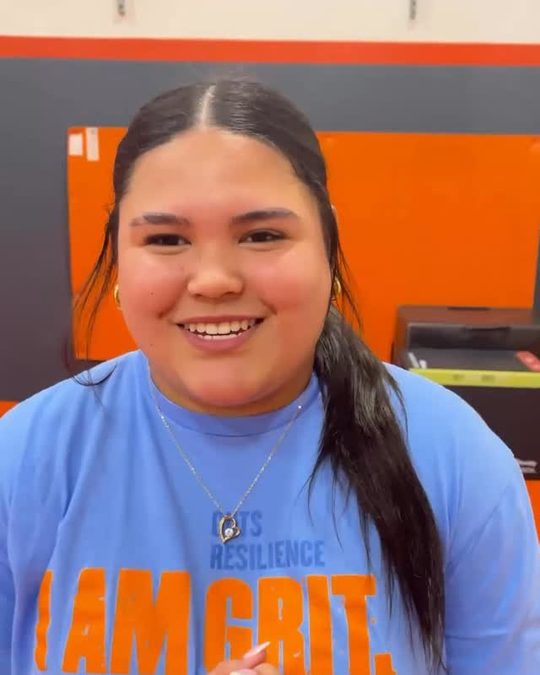
The last 12 posts on @gritworks the day before Suubi Media took over, next to the last 12 posts four months later. Parents scroll the grid before they ever book a call.
March 1, 2026
Before
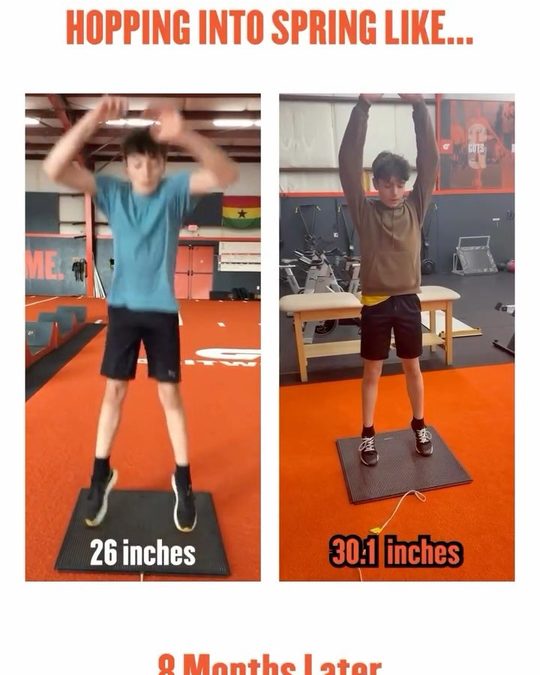


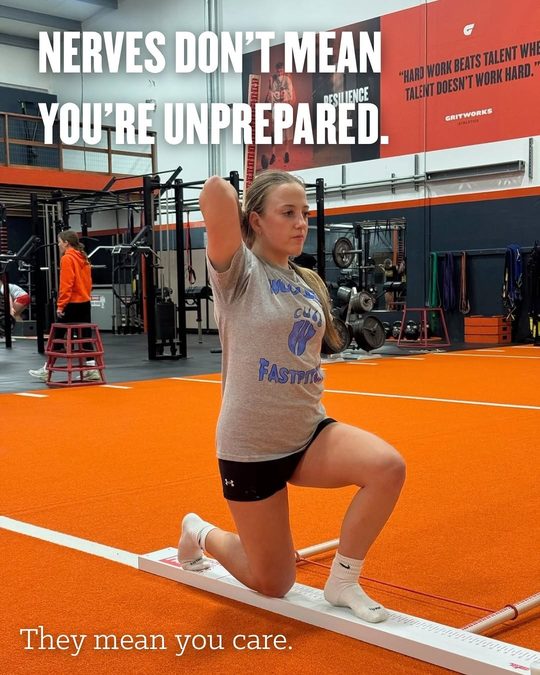

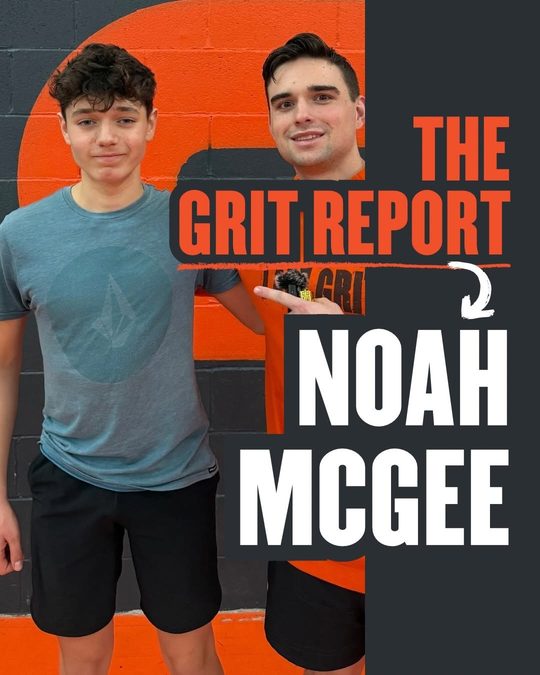
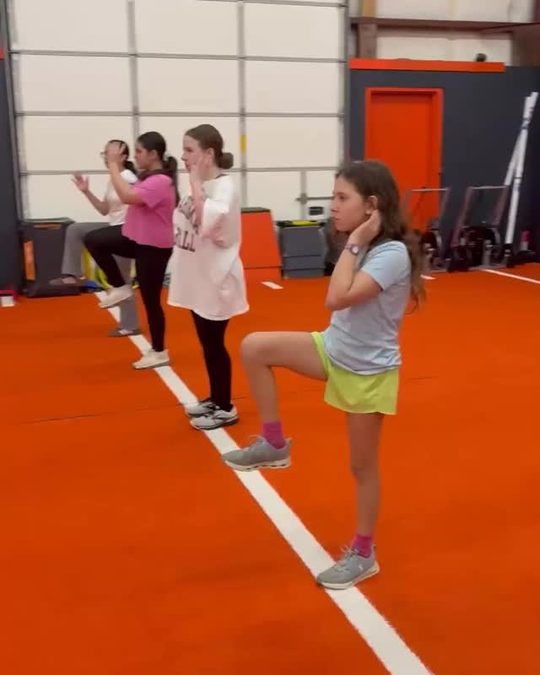
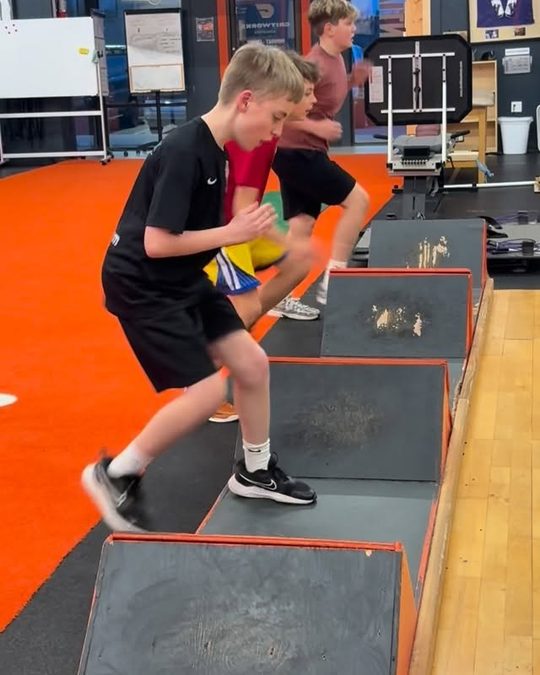

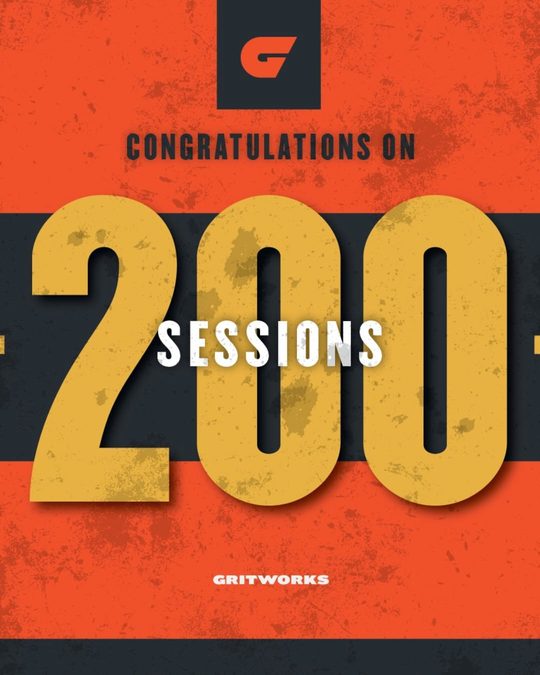
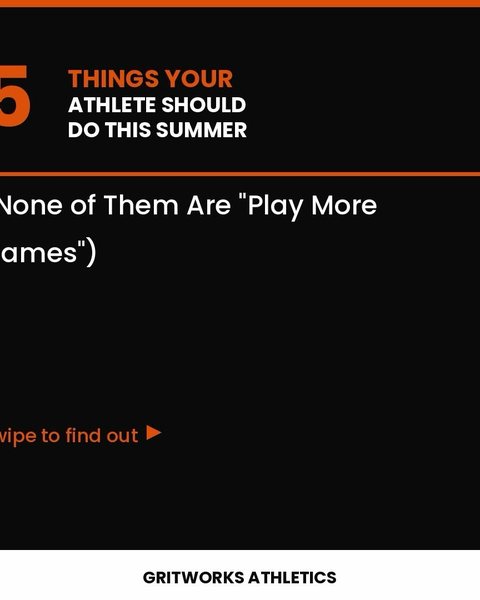
About 19 posts a month. Milestones like Athlete of the Month and session counts were text only graphics.
July 1, 2026
Four months in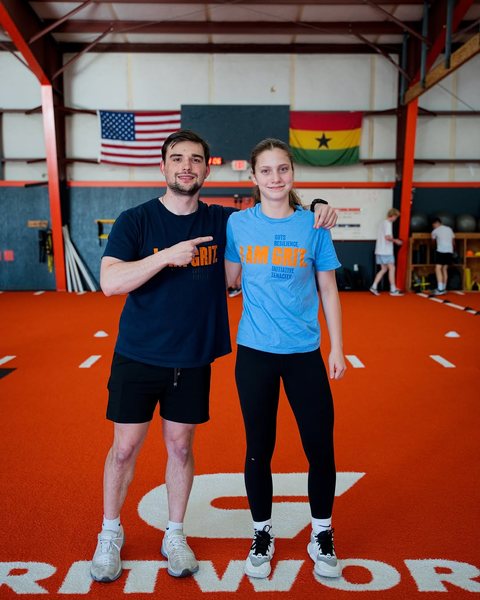
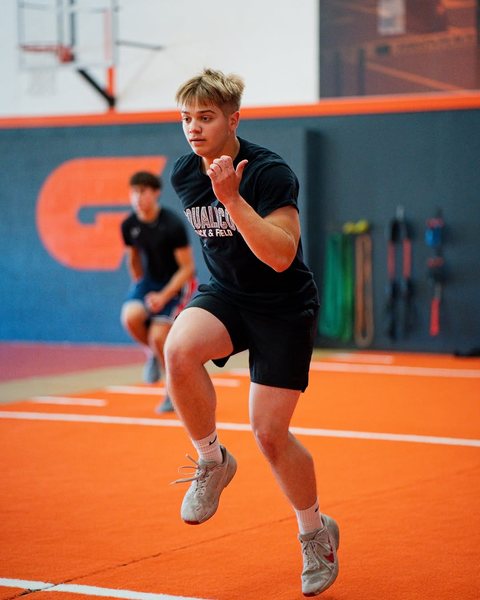
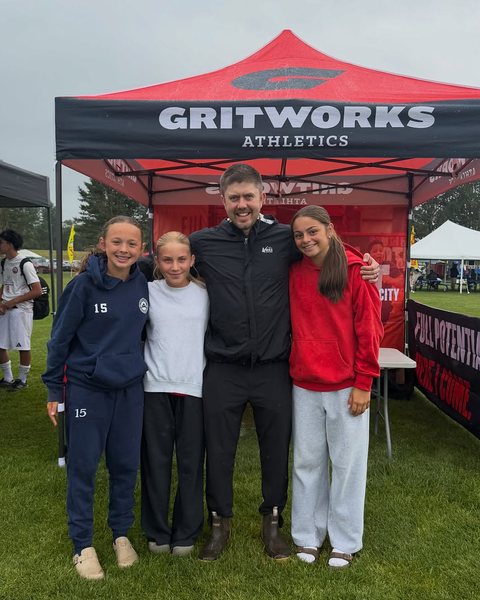
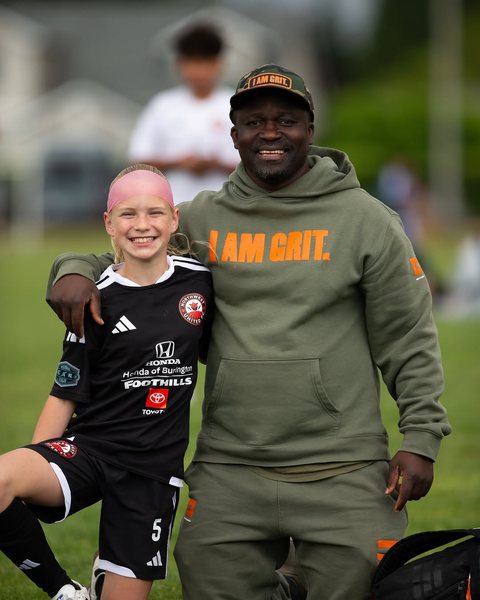


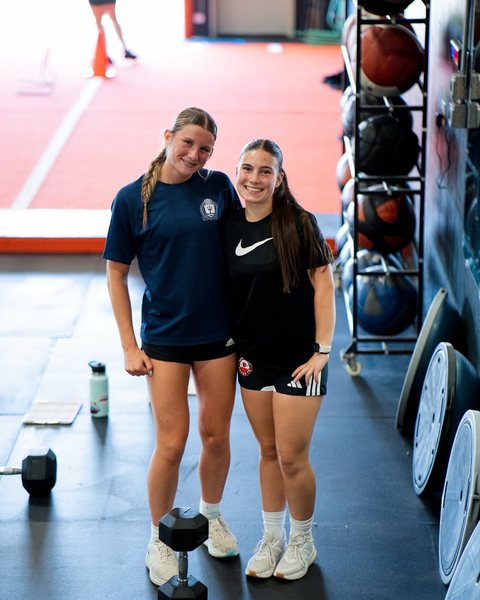


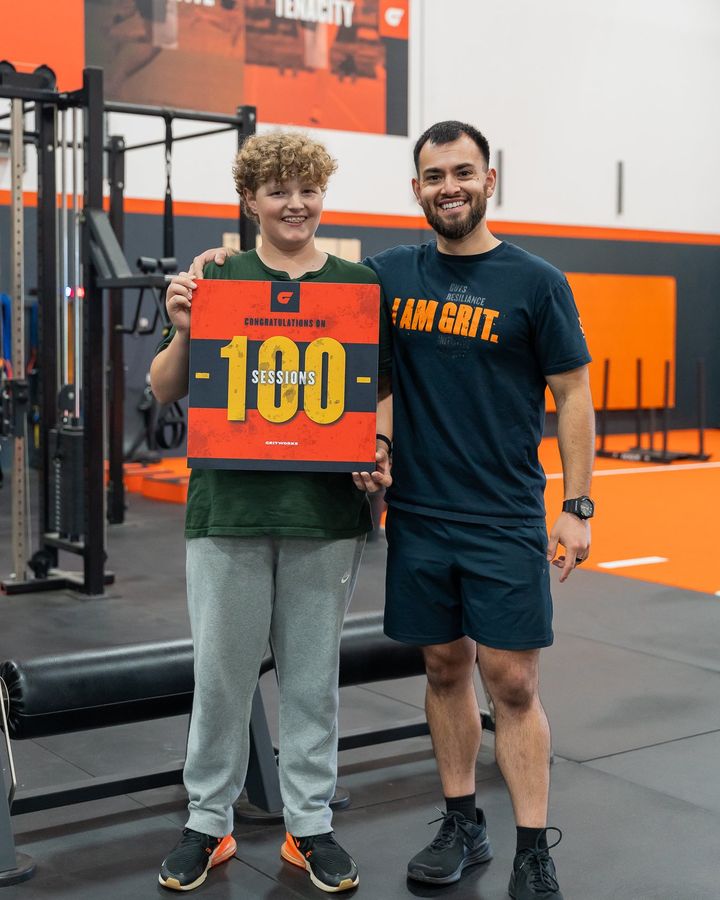
Real athletes in the gym and out at tournaments. Milestones like 100 sessions are now the athlete holding the sign, not a text graphic.
Grit Gains Club milestones
From a text graphic to the athlete holding the milestone. Drag to compare.
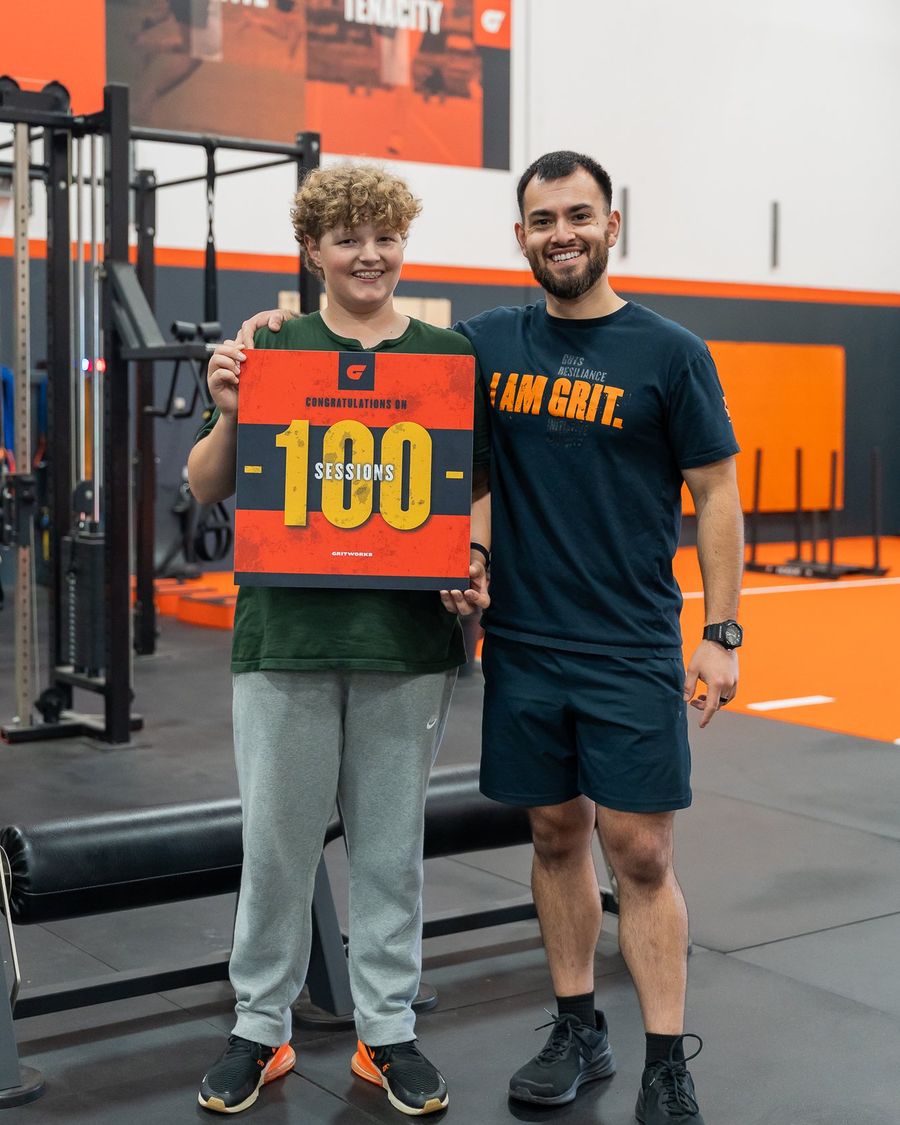
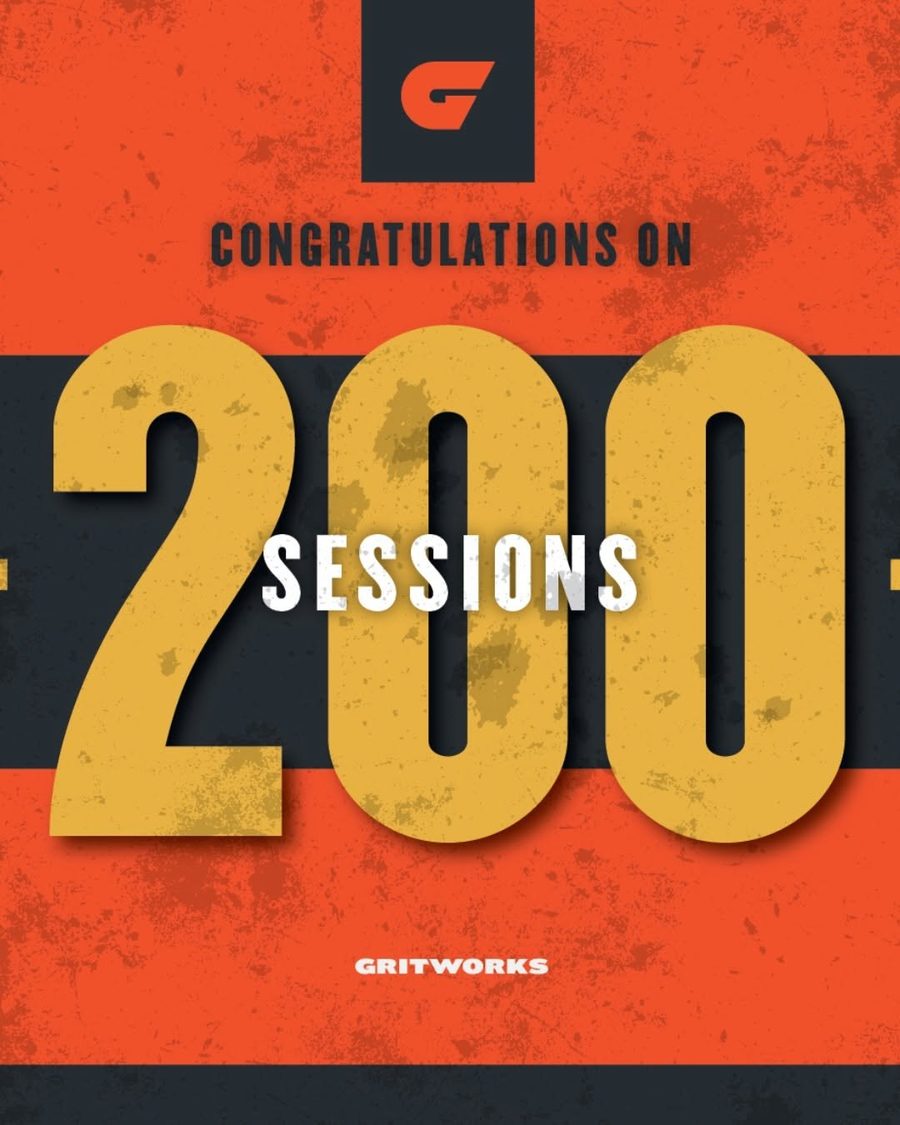
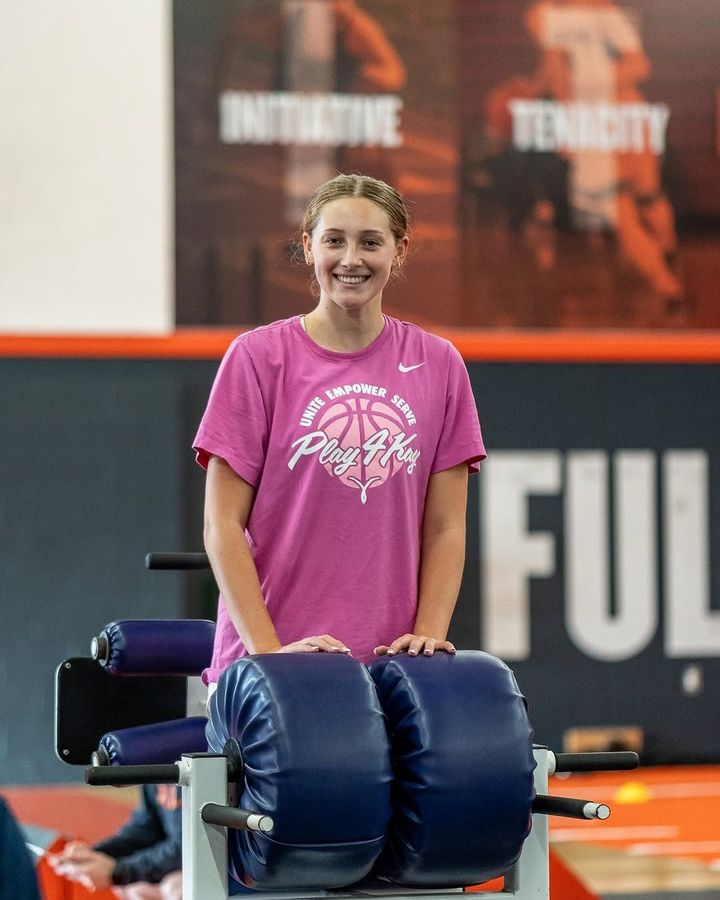
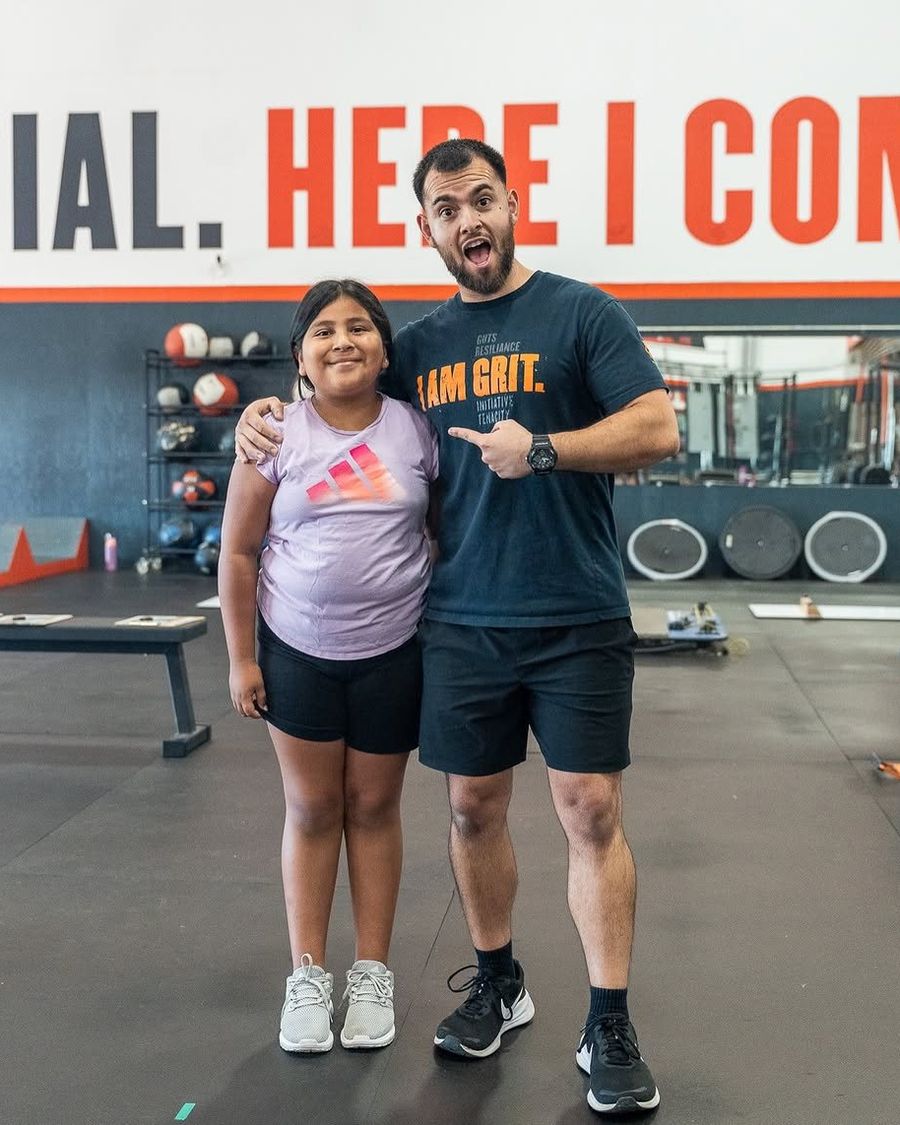
Athlete of the Month
The same franchise, now built around the athlete's face and name.

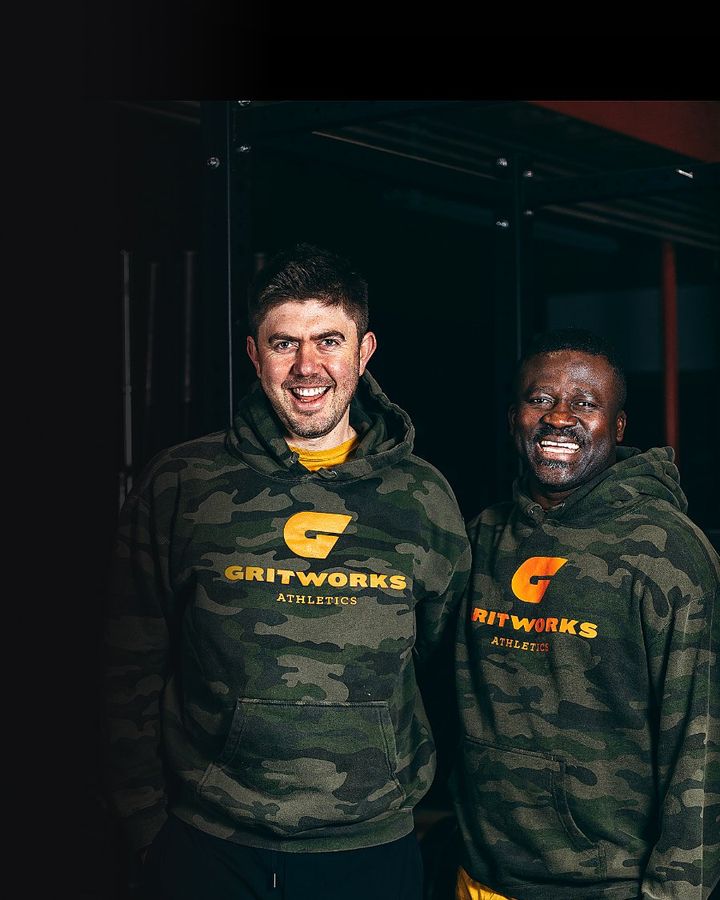
Their website. His camera.
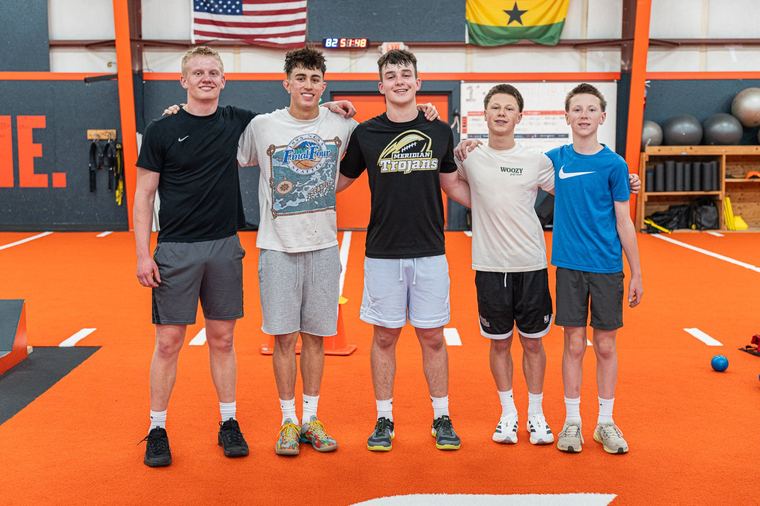
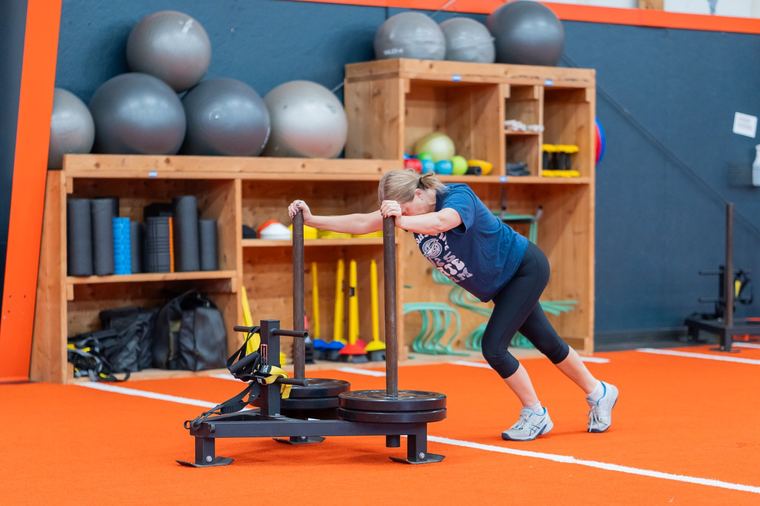
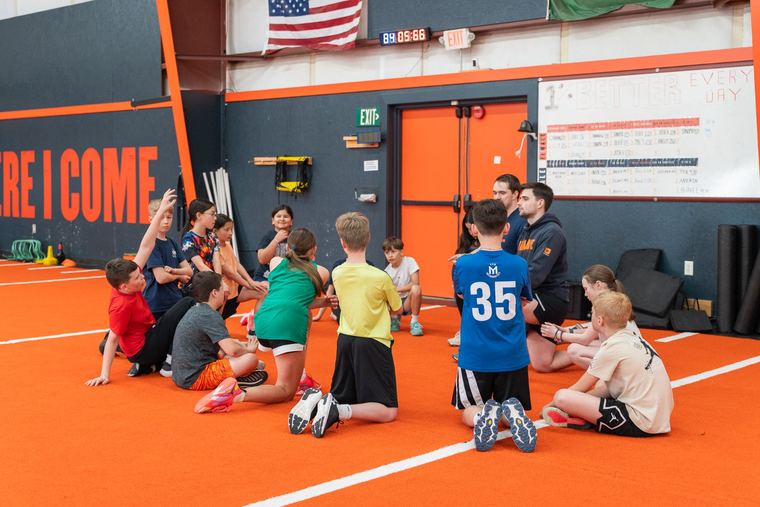
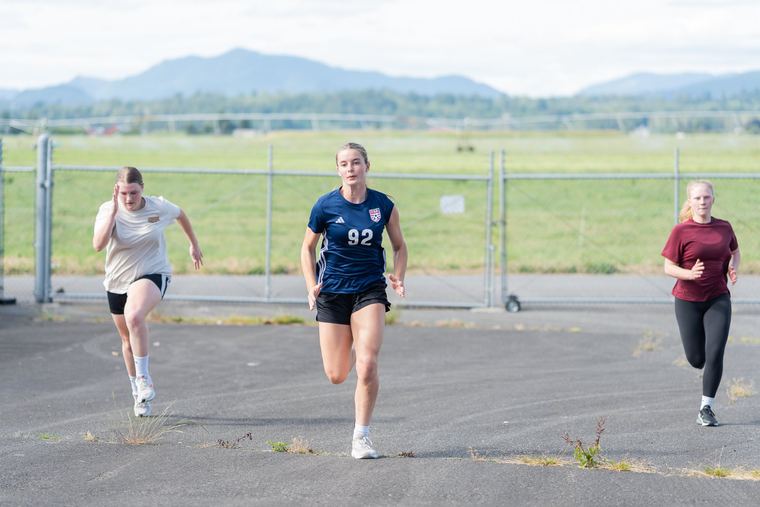
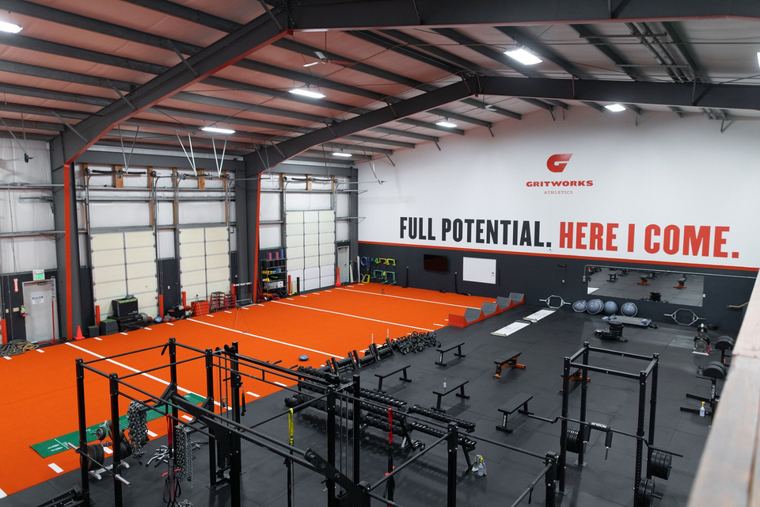
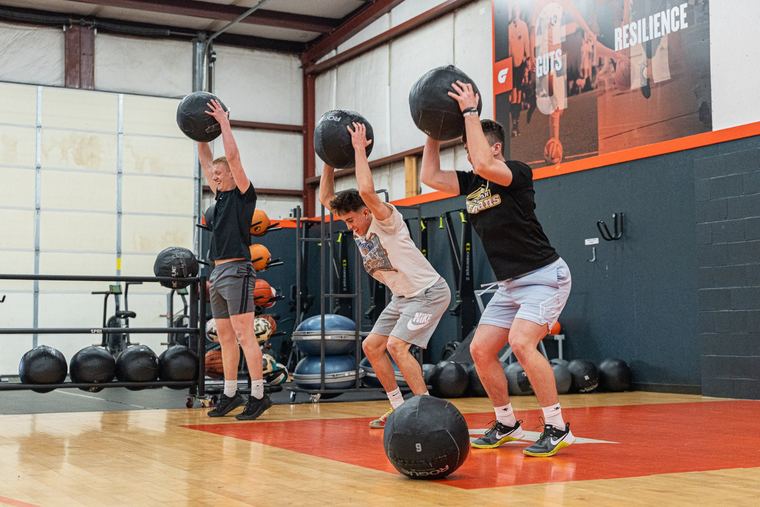
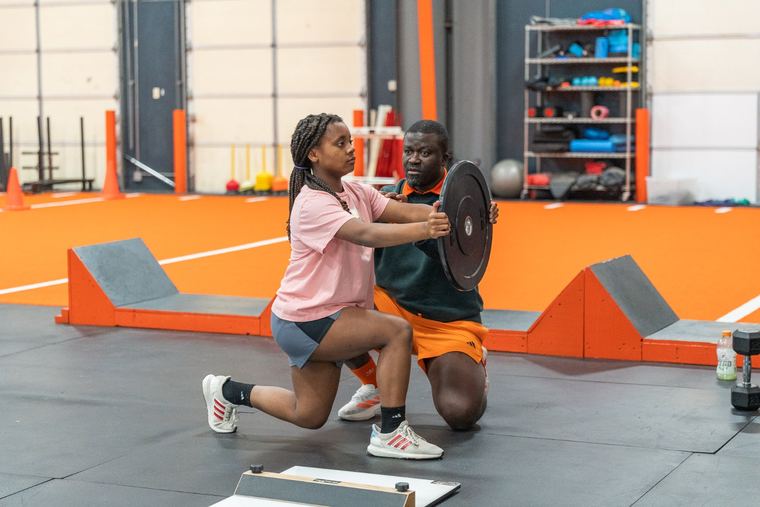
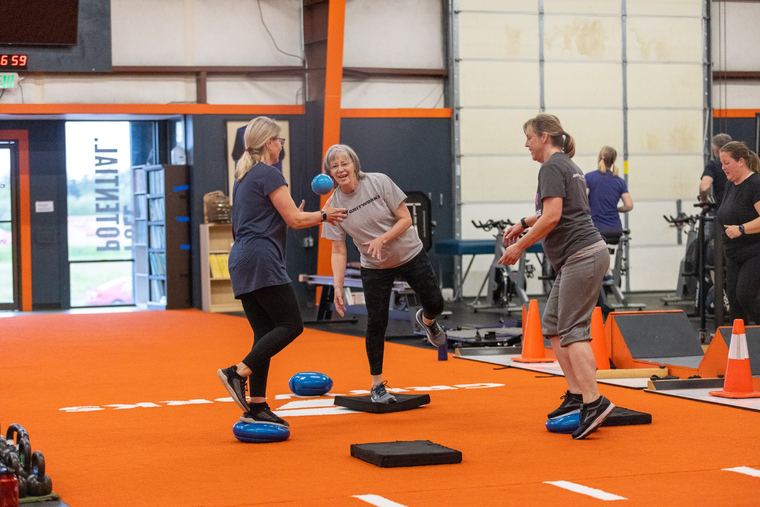
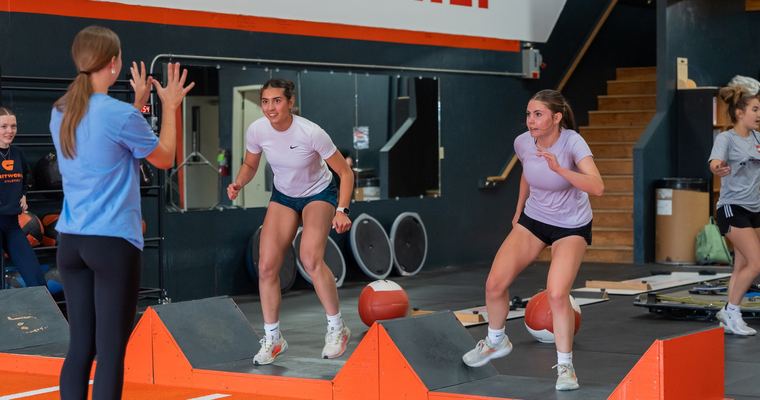
Suubi Media did not build gritworksathletics.com. Every facility photo, athlete photo and video on it is his: the hero film, the program cards, the coaches, both gyms.

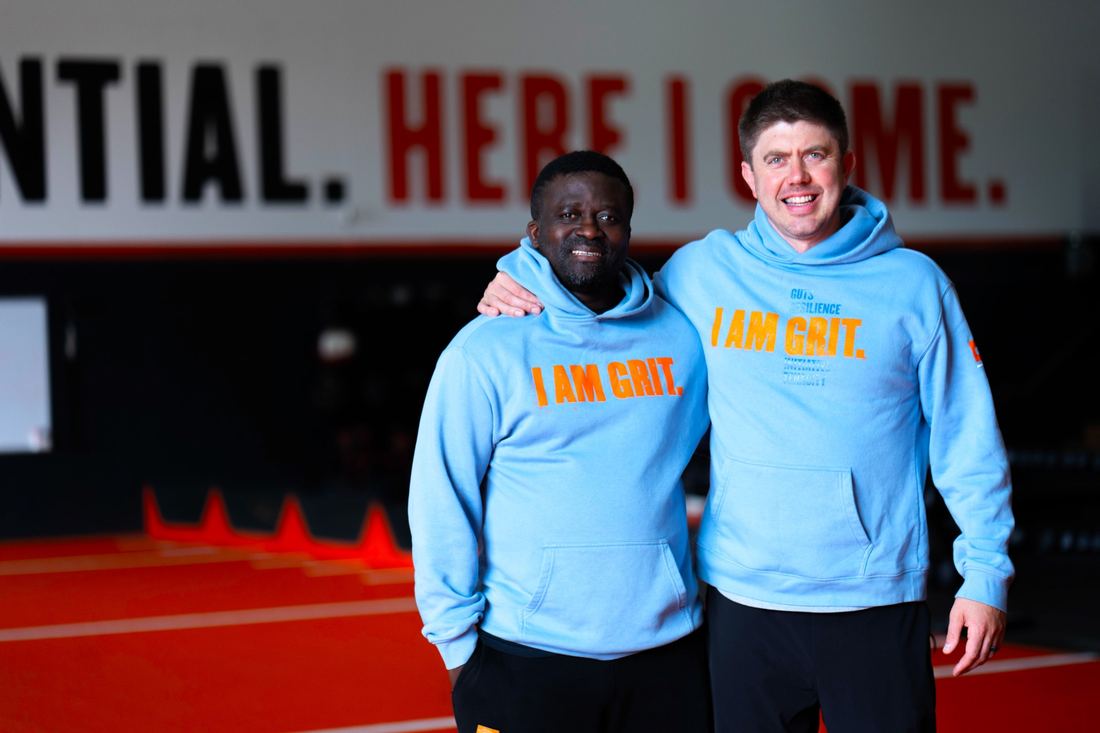

What changed behind the posts.
Better numbers came from a repeatable system, planned a month ahead, that a busy gym can keep running.
The kid is the hero of every milestone.
Session milestones and monthly features lead with the athlete, photographed in the gym, so families share them.
Formats people come back for.
Athlete of the Month at both gyms, Grit Gains Club milestones, parent education, and family nights, each on a steady rhythm.
About 6 a month, not 13.
Each one planned, filmed and cut for the first two seconds, with captions that sound like a coach, not an ad.
Every post points to a consult.
Captions follow the StoryBrand frame. The athlete is the hero, Gritworks is the guide, and the next step is a free athlete consultation.
Every photo, film and graphic since 2019, in one place.
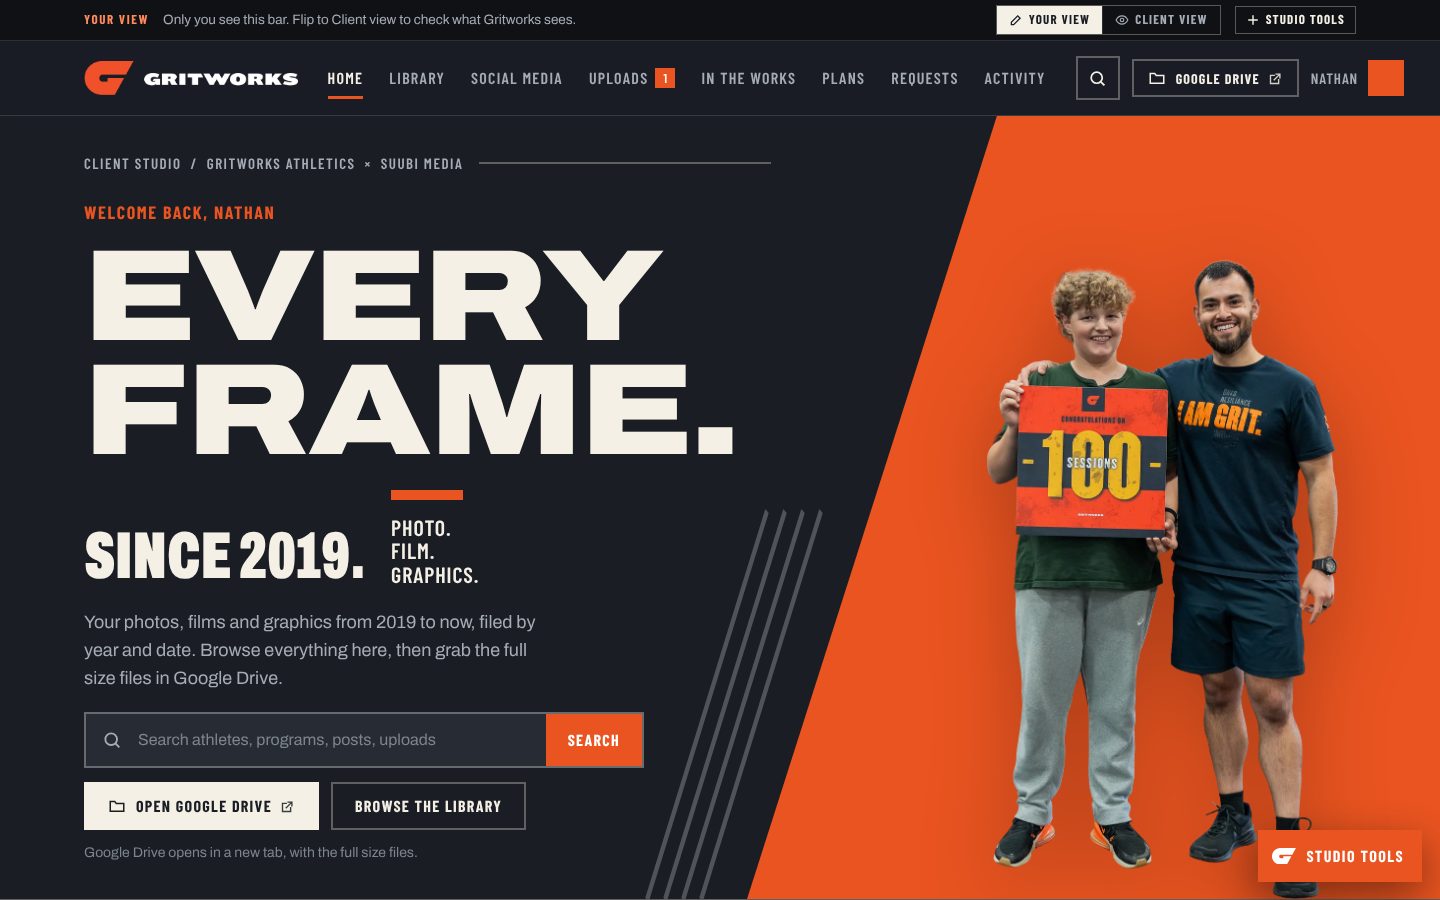
A private studio for the Gritworks team with search, Google Drive links, an uploads lane for coaches and a full activity log.
Reach tripled in four weeks.
From Instagram Insights in the weekly scorecard Suubi Media built for the team. The jump started the week education reels went out, starting March 24.
Average people reached per day on @gritworks.
The full comparison.
The six months before Suubi Media took over, next to its first six months, on the main @gritworks account.
| Measure | BeforeSep 2, 2025 to Mar 1, 2026 | With Suubi MediaMar 2 to Aug 31, 2026 | Change |
|---|---|---|---|
| Reels posted | 78 | 35 | 55% fewer |
| Median views per reel | 1,880 | 3,042 | +62% |
| Average views per reel | 1,980 | 3,537 | +79% |
| Reels over 3,000 views | 4 | 18 | 4.5x |
| Total reel views | 154,405 | 123,808 | 80% of the viewsfrom 45% of the reels |
| Best single reel | 5,558 | 17,500 | 3.1x |
| Average daily reachFirst month, week one to week four | 374 | 1,170 | 3.1x |
How views were counted
Public view counts on every @gritworks reel, read on October 17, 2026. Dates come from each post. The window ends August 31, 2026, so it covers Suubi Media's six months and nothing after.
Why likes are not compared
Like counts are hidden on most posts from 2026, so views are the fair public measure across both periods.
Where reach came from
First month reach, interactions and shares come from Instagram Insights, pulled into the team's weekly scorecard for March 7 to April 5, 2026.
Every site we have made, live.
Restaurants, barbershops, gyms, churches, shops and clubs across Bellingham and Seattle. Each one built from the business's own photos and words. Tap any one and it opens.